
The ADHD-200 Global Competition
A phenotypic file including all of the test set subjects and their diagnostic codes can be downloaded here: Complete Test Set Phenotypic CSV
The ADHD-200 Consortium is proud to announce the winners of the “ADHD-200 Global Competition”. The competition invited participants to develop diagnostic classification tools for ADHD diagnosis based on functional and structural magnetic resonance imaging (MRI) of the brain. Applying their tools, participants provided diagnostic labels for previously unlabeled datasets. The competition assessed diagnostic accuracy of each submission and invited research papers describing novel, neuroscientific ideas related to ADHD diagnosis. Twenty-one international teams, from a mix of disciplines, including statistics, mathematics, and computer science, submitted diagnostic labels, with some trying their hand at imaging analysis and psychiatric diagnosis for the first time.
The data for the competition was provided by the ADHD-200 Consortium - a self-organized, grassroots initiative, dedicated to accelerating the scientific community's understanding of the neural basis of ADHD through the implementation of discovery-based science. Consortium members from institutions around the world provided de-identified, HIPAA compliant imaging datasets from almost 800 children with and without ADHD.
The ADHD-200 consortium included:
- Brown University, Providence, RI, USA (Brown)
- The Kennedy Krieger Institute, Baltimore, MD, USA (KKI)
- The Donders Institute, Nijmegen, The Netherlands (NeuroImage)
- New York University Medical Center, New York, NY, USA (NYU)
- Oregon Health and Science University, Portland, OR, USA (OHSU)
- Peking University, Beijing, P.R.China (Peking 1-3)
- The University of Pittsburgh, Pittsburgh, PA, USA (Pittsburgh)
- Washington University in St. Louis, St. Louis, MO, USA (WashU)
The data were organized and published online through the International Neuroimaging Data-sharing Initiative (INDI). The ADHD-200 Sample is part of a movement towards open science and collaboration fostered by INDI and the 1000 Functional Connectomes Project.
Imaging-Based Diagnostic Classification Contest
The winner is a team from Johns Hopkins University, including Brian Caffo, Ciprian Crainiceanu, Ani Eloyan, Fang Han, Han Liu, John Muschelli, Mary Beth Nebel, and Tuo Zhao. The team from Johns Hopkins University scored 119 out of 195 points, with one point awarded per correct diagnosis (typically developing, ADHD primarily inattentive type, or ADHD combined type). A half point was awarded for a diagnosis of ADHD with incorrect subtype.
The method developed by the team from Johns Hopkins University excelled in its specificity, or its ability to identify typically developing children (TDC) without falsely classifying them as ADHD-positive. They correctly classified 94% of TDC, showing that a diagnostic imaging methodology can be developed with a very low risk of false positives, a fantastic result. Their method was not as effective in terms of sensitivity, or its ability to identify true positive ADHD diagnoses. They only identified 21% of cases; however, among those cases, they discerned the subtypes of ADHD with 89.47% accuracy. Other teams demonstrated that there is ample room to improve sensitivity scores. The methods developed by teams from the Chinese Academy of Sciences and the University of North Carolina at Chapel Hill both scored well on the J-statistic, a joint measure of specificity and sensitivity, suggesting that tests can be developed that satisfy needs in both these crucial diagnostic areas.
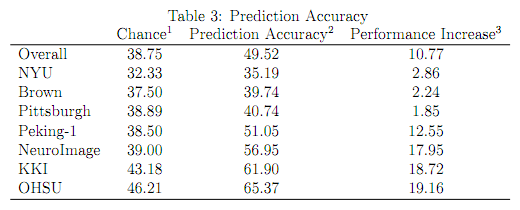
If participants were to predict diagnosis by chance, a prediction accuracy ranging between 33% and 38.75% would be expected (more details are provided below). However, participants’ predictions trumped chance by a healthy margin, with an average prediction accuracy of 49.79% (range: 37.44% - 60.51%; 54.09% for datasets included in the training set; 40.24% for datasets not included in the training set).
Participants were able to develop predictive methods that performed significantly better than chance analyzing datasets that were gathered in an uncoordinated way by multiple centers. These results suggest that effective methods can be developed in less-than-ideal and poorly controlled environments. We expect that these results will guide the psychiatric neuroimaging field as it grows. Despite the success of the methods developed in this competition, further development is necessary before the methods can be used in a clinical setting.
Importantly, while the intent of the competition was imaging-based classification, the team of the University of Alberta, Gagan Sidhu, Matthew Brown, Russell Greiner, Nasimeh Asgarian, and Meysam Bastani, scored 124 points using all available phenotypic data while excluding imaging data – 5 more points than the winning imaging-based classification approach. Their feat highlights both the need for carefully coordinated imaging datasets for the development of analytic tools, and that diagnostic imaging tools have not yet reached full maturity. Their work reminds us to embrace limitations while celebrating the advances of this discipline.
Most Innovative Neuroscience Examination Contest
The winner in this contest is Che-Wei Chang from the National Taiwan University, who brought emerging analytic approaches in computer vision to the study of ADHD-related differences in brain morphometry. By capturing novel aspects of brain anatomy, this effort defined a new feature upon which brain differences can be characterized and classified.
Conclusions
The ADHD-200 Global Competition illustrates, in addition to the dedication and skill of the participants, three major lessons about imaging research and the future of brain science.
- Open data sharing yields results. The contestants were faced with more data than many of them had ever seen before, but in a short amount of time were able to analyze the data and make working models. This would be impossible if this information were not free and freely available. However, these samples, though relatively large for the field, are still much smaller than they need to be to make these techniques applicable in clinical settings.
- Collaboration is key. The winning group from Johns Hopkins University was made up of statisticians, giving a glimpse into what the future could hold if we dramatically open neuroimaging disciplines to cross-pollination. This group also made use of a preprocessed version of the ADHD-200 dataset provided by the Neuro Bureau, illustrating how scientists with different skill sets can augment and bolster the achievements of others.
- The future depends on bold and cautious effort. Large, coordinated recruitment of datasets and diagnostic studies are necessary to improve the accuracy and repeatability of these diagnostic imaging methods. And it is precisely because of the fact that we need such bold action to achieve these future goals that we must be cautious about current perceptions of this technology. There are some who claim imaging is ready for “prime time;” but this will never happen if the community does not continue to soberly evaluate this promising area of research.
More Results of the ADHD-200 Competition
Prediction Accuracy by Chance
Given the type of data that was provided (TDC, ADHD combined type [ADHD-1]), ADHD inattentive type [ADHD-3]), two classification approaches come to mind that can be applied to the dataset.
- The first is a hierarachical two-class classifier where teams first decide who is TDC and who is ADHD. Next they decide in the ADHD class who is ADHD-1 or ADHD-3. Applying this approach to the TestSet using chance level would yield 38.75% prediction accuracy. Based on the scoring schema of the competition that awards 1 point for a correct prediction and 0.5 points for correctly predicted ADHD, but incorrect subtype, this classifier would lead to a chance score of 86.5 points out of 195 (44.36%).
- The second approach uses a simple three-class classifier. For each datapoint teams decide whether the datapoint was from TDC, ADHD-1 or ADHD-3. Applying this approach using 0.33 chance level would yield 33% prediction accuracy. Based on the scoring schema of the competition such classifier would lead to a chance score of 75.9 points out of 195 (38.92%).
Prediction Accuracy Across All Test Data
- Assessing the percentage of correct predictions, all teams except one demonstrated greater overall accuracy than predicated based on chance (see above). The average prediction accuracy across teams was 49.79% and ranged between 37.44% and 60.51% (see table 3).
- Percentage prediction accuracy ranged between 43.08% and 61.54% (mean = 56.02%) when using a two-class classifier to classify TDC vs. ADHD, disregarding the ADHD subtypes.
- Teams were better at predicting TDC (mean accuracy = 71.77%; range = 45.79 - 94.39), compared to predicting ADHD regardless of subtype (mean accuracy = 37.44%; range = 18.18 - 52.27; t-test comparing the two p < 0.001).
- When teams correctly predicted an ADHD diagnosis, they correctly predicted the subtype in 62.79% of the cases. Of those, 79% were ADHD-1, and 21% were ADHD-3. Considering that 67% of ADHD in the TestSet were ADHD-1 and 33% were ADHD-3, it can be tentatively concluded that on average, correct subtype prediction did favor the ADHD-1 subtype.
- Accordingly, in 37.21% of cases teams correctly predicted ADHD, but assigned an incorrect subtype. In those cases, teams were equally likely to assign ADHD-1 to ADHD-3 and vice versa (52% of incorrect subtype cases were ADHD-1, 47.98% were ADHD-3).
- Considering that 55% of the TestSet were TDC, 30% ADHD-1, and 15% ADHD-3, teams overly favored TDC (67.45%) over ADHD-1 (22.09%) and ADHD-3 (10.46%) in their predictions. This is also shown in figure 2.
- Figure 3 shows where on average teams made errors in the diagnostic classification. Most errors were made classifying ADHD-1 as TDC, ADHD-3 as TDC, and TDC as ADHD-1. Classifying ADHD-1 and ADHD-3 as TDC combined to 57% of errors made, indicating that on average the classification methods were being overly cautious, exhibiting low sensitivity. Indeed, ADHD datasets were more likely to be classified as TDC than as ADHD with the incorrect subtype (13% of errors made).
- The numbers cited above resulted in and average specificity of 72%, and an average sensitivity of 38%. Figure 4 shows the ROC curve using all entries.
Prediction Accuracy in the Individual TestSets
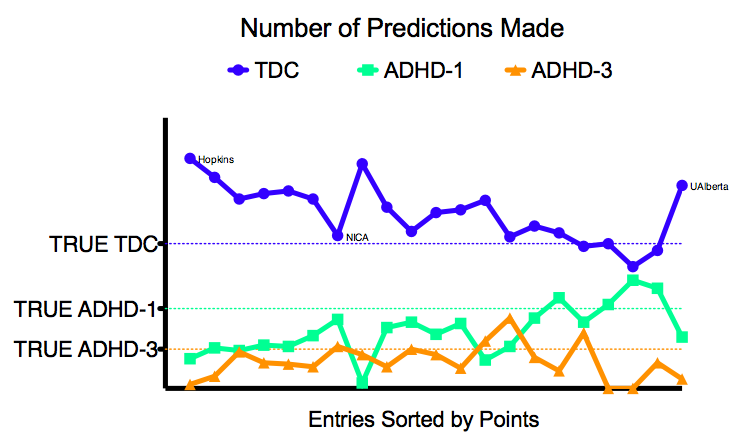
Teams were provided training data from KKI, NeuroImage, NYU, OHSU, Pittsburgh (only controls), WashU (only controls) and Peking (3 different scan protocols). Test datasets came from Brown (not in training data), KKI, NeuroImage, NYU, OHSU, Peking-1, and Pittsburgh (different protocol compared to training data). As can be derived from table 3 and figure 1, teams performed best for OHSU and worst for NYU.
From figure 1 it is also clear that teams performed better on datasets that were included in the initial training set. Yet, they performed worst on the NYU data. This result can however, be explained by the fact that the NYU test set had a very different composition compared to the NYU training set. While the NYU training set included 45% data from TDC and 55% data from ADHD, the NYU test set included 30% data from TDC and 70% data from ADHD. Given the fact that teams were generally more prone to classify the test sets as TDC, it is clear that the NYU test set was more sensitive to such classification bias. In KKI, NeuroImage, OHSU and Peking-1 the ratio of TDC/ADHD in the test set was comparable to that of the training data.
Interesting Observations
J-Statistic
The J-Statistic is calculated as specificity + sensitivity -1 and is thus a combination measure of specificity and sensitivity. A high J-Statisic indicates high sensitivity and high specificity, while a J-Statistic < 0 indicates that both specificity and sensitivity are < 50%. As shown in figure 5 the entry from Johns Hopkins University did not have the highest J-Statistic, instead it ranked 6th. Teams from the University of North Carolina at Chapel Hill (UNC) and the Neural Imaging Computation and Analysis Group (NICA) at the Chinese Academy of Sciences exhibited nearly similar J-Statistics. With UNC having a slightly higher specificity and NICA having a slightly higher sensitivity. Both teams outranked the other teams by 1 J-Statistic point. However, NICA performed slightly better compared to UNC as NICA gathered 108.5 points (versus 105 for UNC) and attained 51.28% accuracy (versus 47.69% for UNC).
Compared to the team from Johns Hopkins University, NICA has a better chance of distinguishing ADHD from TDC. However, when deciding on the specific subtype they outperform chance by a much smaller margin than the team from Johns Hopkins University (67% for NICA, 89% for Johns Hopkins University vs. 50% chance level).
The team from the University of Alberta
The team from the University of Alberta did not use imaging data for their prediction model. This was not consistent with intent of the competition. Instead they used only age, sex, handedness, and IQ. However, in doing so they obtained the most points, outscoring the team from Johns Hopkins University by 5 points, as well as obtaining the highest prediction accuracy (62.52%).
Figures
| Figure 1 | Figure 2 |
 |
 |
| Figure 3 | Figure 4 |
 |
 |
| Figure 5 | Figure 6 |
 |
 |
| Figure 7 | |
 |
|
Tables
| Table 3 |
 |
Results Preparation Credits
Maarten Mennes, Sharad Sikka, Brett Lullo, Qingyang Li, Brian Cheung, Damien Fair, & Michael Milham